 |
 |
 |
 |
 |
 |
 |
 |
 |
 |
 |
 |
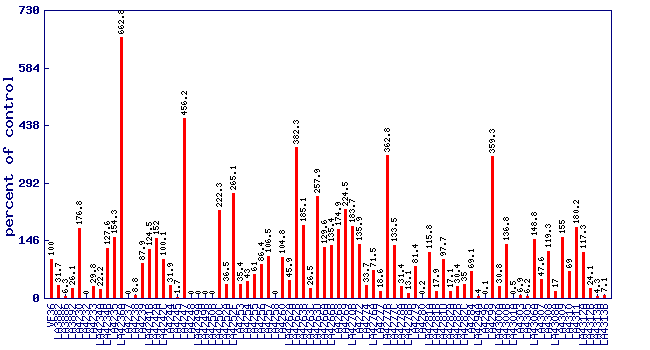
| Relative 3-methyl-1-butanol level (percent of control)* Experiment: flavor related metabolite profiling in S. lycopersicoides IL lines (FL, Fall 2015) |
 |
| line | relative level (percent of control) |
|---|---|
| VF36 | 100 |
| LA3882 | 31.7 |
| LA3886 | 6.3 |
| LA3892 | 26.1 |
| LA4230 | 176.8 |
| LA4232 | 0 |
| LA4233 | 29.8 |
| LA4234A | 22.2 |
| LA4234B | 127.6 |
| LA4235 | 154.3 |
| LA4236A | 662.8 |
| LA4237 | 0 |
| LA4238 | 8.8 |
| LA4239 | 87.9 |
| LA4241B | 124.5 |
| LA4242A | 152 |
| LA4242C | 100.1 |
| LA4244 | 31.9 |
| LA4245 | 1.7 |
| LA4247 | 456.2 |
| LA4248 | 0 |
| LA4249A | 0 |
| LA4249B | 0 |
| LA4250B | 0 |
| LA4250C | 222.3 |
| LA4252A | 36.5 |
| LA4252F | 265.1 |
| LA4253 | 35.4 |
| LA4254 | 43 |
| LA4255 | 61 |
| LA4256 | 86.4 |
| LA4257 | 106.5 |
| LA4258 | 0 |
| LA4260 | 104.8 |
| LA4262A | 45.9 |
| LA4262B | 382.3 |
| LA4263B | 185.1 |
| LA4263C | 26.5 |
| LA4263D | 257.9 |
| LA4266A | 129.6 |
| LA4266B | 135.4 |
| LA4268 | 174.9 |
| LA4269 | 224.5 |
| LA4270B | 183.7 |
| LA4272 | 135.9 |
| LA4274 | 33.7 |
| LA4276A | 71.5 |
| LA4277 | 18.6 |
| LA4277B | 362.8 |
| LA4277C | 133.5 |
| LA4278A | 31.4 |
| LA4278B | 13.1 |
| LA4279 | 81.4 |
| LA4280 | 0.2 |
| LA4281A | 115.8 |
| LA4281B | 17.9 |
| LA4281D | 97.7 |
| LA4282A | 17.1 |
| LA4282B | 30.4 |
| LA4282C | 35 |
| LA4284 | 69.1 |
| LA4294A | 4 |
| LA4296 | 0.1 |
| LA4299 | 359.3 |
| LA4300A | 30.8 |
| LA4300B | 136.8 |
| LA4301A | 0.5 |
| LA4303 | 6.9 |
| LA4305 | 6.2 |
| LA4306A | 148.8 |
| LA4307 | 47.6 |
| LA4308 | 119.3 |
| LA4308A | 17 |
| LA4309 | 155 |
| LA4310 | 69 |
| LA4311 | 180.2 |
| LA4312A | 117.3 |
| LA4312B | 24.1 |
| LA4313A | 4.3 |
| LA4313B | 7.1 |
* Note
|