 |
 |
 |
 |
 |
 |
 |
 |
 |
 |
 |
 |
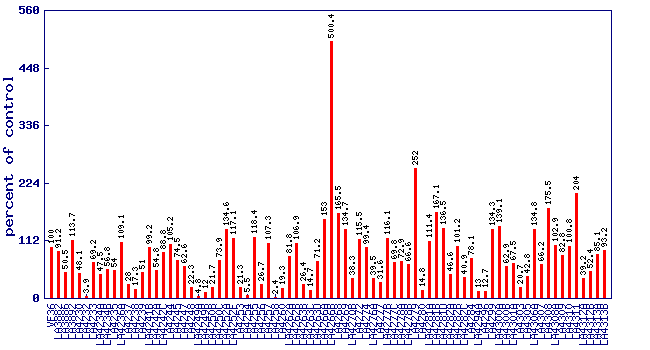
| Relative 6-methyl-5-hepten-2-one level (percent of control)* Experiment: flavor related metabolite profiling in S. lycopersicoides IL lines (FL, Fall 2015) |
 |
| line | relative level (percent of control) |
|---|---|
| VF36 | 100 |
| LA3882 | 91.2 |
| LA3886 | 50.5 |
| LA3892 | 113.7 |
| LA4230 | 48.1 |
| LA4232 | 3.9 |
| LA4233 | 69.2 |
| LA4234A | 47.5 |
| LA4234B | 56.8 |
| LA4235 | 54 |
| LA4236A | 109.1 |
| LA4237 | 28 |
| LA4238 | 17.3 |
| LA4239 | 51 |
| LA4241B | 99.2 |
| LA4242A | 54.8 |
| LA4242C | 88.8 |
| LA4244 | 105.2 |
| LA4245 | 74.5 |
| LA4247 | 62.6 |
| LA4248 | 22.3 |
| LA4249A | 4.8 |
| LA4249B | 12 |
| LA4250B | 21.7 |
| LA4250C | 73.9 |
| LA4252A | 134.6 |
| LA4252F | 117.1 |
| LA4253 | 21.3 |
| LA4254 | 5.5 |
| LA4255 | 118.4 |
| LA4256 | 26.7 |
| LA4257 | 107.3 |
| LA4258 | 2.4 |
| LA4260 | 19.3 |
| LA4262A | 81.8 |
| LA4262B | 106.9 |
| LA4263B | 26.4 |
| LA4263C | 14.7 |
| LA4263D | 71.2 |
| LA4266A | 153 |
| LA4266B | 500.4 |
| LA4268 | 165.5 |
| LA4269 | 134.7 |
| LA4270B | 38.3 |
| LA4272 | 115.5 |
| LA4274 | 99.4 |
| LA4276A | 39.5 |
| LA4277 | 31.6 |
| LA4277B | 116.1 |
| LA4277C | 69.8 |
| LA4278A | 72.9 |
| LA4278B | 66.6 |
| LA4279 | 252 |
| LA4280 | 14.8 |
| LA4281A | 111.4 |
| LA4281B | 167.1 |
| LA4281D | 136.5 |
| LA4282A | 46.6 |
| LA4282B | 101.2 |
| LA4282C | 40.9 |
| LA4284 | 78.1 |
| LA4294A | 13 |
| LA4296 | 12.7 |
| LA4299 | 134.3 |
| LA4300A | 139.1 |
| LA4300B | 62.9 |
| LA4301A | 67.5 |
| LA4303 | 20.7 |
| LA4305 | 42.8 |
| LA4306A | 134.8 |
| LA4307 | 66.2 |
| LA4308 | 175.5 |
| LA4308A | 102.9 |
| LA4309 | 82.8 |
| LA4310 | 100.8 |
| LA4311 | 204 |
| LA4312A | 39.2 |
| LA4312B | 52.4 |
| LA4313A | 85.1 |
| LA4313B | 93.2 |
* Note
|