 |
 |
 |
 |
 |
 |
 |
 |
 |
 |
 |
 |
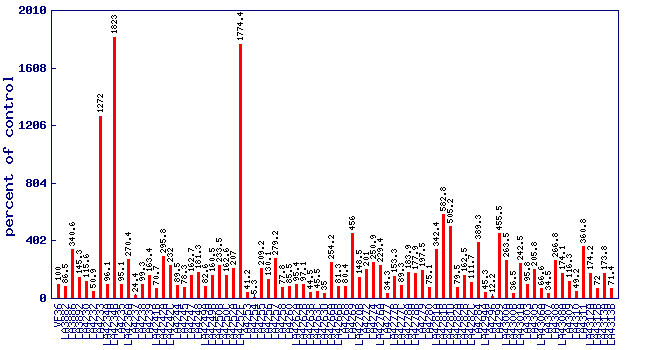
| Relative cis-3-hexen-1-ol level (percent of control)* Experiment: flavor related metabolite profiling in S. lycopersicoides IL lines (FL, Fall 2015) |
 |
| line | relative level (percent of control) |
|---|---|
| VF36 | 100 |
| LA3882 | 86.5 |
| LA3886 | 340.6 |
| LA3892 | 145.3 |
| LA4230 | 115.6 |
| LA4232 | 50.9 |
| LA4233 | 1272 |
| LA4234A | 96.1 |
| LA4234B | 1823 |
| LA4235 | 95.1 |
| LA4236A | 270.4 |
| LA4237 | 24.4 |
| LA4238 | 99.3 |
| LA4239 | 163.4 |
| LA4241B | 70.7 |
| LA4242A | 295.8 |
| LA4242C | 232 |
| LA4244 | 89.5 |
| LA4245 | 78.3 |
| LA4247 | 162.7 |
| LA4248 | 181.3 |
| LA4249A | 82.6 |
| LA4249B | 160.5 |
| LA4250B | 233.5 |
| LA4250C | 162.6 |
| LA4252A | 207 |
| LA4252F | 1774.4 |
| LA4253 | 41.2 |
| LA4254 | 5.3 |
| LA4255 | 209.2 |
| LA4256 | 130.1 |
| LA4257 | 279.2 |
| LA4258 | 77.8 |
| LA4260 | 85.5 |
| LA4262A | 95.4 |
| LA4262B | 97.1 |
| LA4263B | 44.5 |
| LA4263C | 45.5 |
| LA4263D | 35 |
| LA4266A | 254.2 |
| LA4266B | 81.3 |
| LA4268 | 80.4 |
| LA4269 | 456 |
| LA4270B | 148.5 |
| LA4272 | 201 |
| LA4274 | 250.9 |
| LA4276A | 229.4 |
| LA4277 | 34.3 |
| LA4277B | 153.3 |
| LA4277C | 89.3 |
| LA4278A | 183.9 |
| LA4278B | 177.9 |
| LA4279 | 197.5 |
| LA4280 | 75.1 |
| LA4281A | 342.4 |
| LA4281B | 582.8 |
| LA4281D | 505.2 |
| LA4282A | 79.5 |
| LA4282B | 162.5 |
| LA4282C | 111.7 |
| LA4284 | 389.3 |
| LA4294A | 45.3 |
| LA4296 | 12.2 |
| LA4299 | 455.5 |
| LA4300A | 263.5 |
| LA4300B | 36.5 |
| LA4301A | 242.5 |
| LA4303 | 95.8 |
| LA4305 | 205.8 |
| LA4306A | 66.6 |
| LA4307 | 34.5 |
| LA4308 | 266.8 |
| LA4308A | 174.1 |
| LA4309 | 116.3 |
| LA4310 | 49.2 |
| LA4311 | 360.8 |
| LA4312A | 174.2 |
| LA4312B | 72 |
| LA4313A | 173.8 |
| LA4313B | 71.4 |
* Note
|