 |
 |
 |
 |
 |
 |
 |
 |
 |
 |
 |
 |
| Relative cis-3-hexenal level (percent of control)* Experiment: flavor related metabolite profiling in S. lycopersicoides IL lines (FL, Fall 2015) |
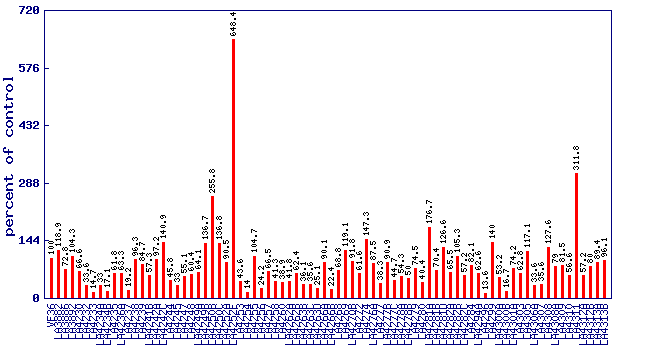 |
| line | relative level (percent of control) |
|---|---|
| VF36 | 100 |
| LA3882 | 118.9 |
| LA3886 | 72.8 |
| LA3892 | 104.3 |
| LA4230 | 66.6 |
| LA4232 | 33.6 |
| LA4233 | 14.7 |
| LA4234A | 33 |
| LA4234B | 17.1 |
| LA4235 | 61.8 |
| LA4236A | 63.3 |
| LA4237 | 19.2 |
| LA4238 | 96.3 |
| LA4239 | 84.7 |
| LA4241B | 57.3 |
| LA4242A | 97.2 |
| LA4242C | 140.9 |
| LA4244 | 45.8 |
| LA4245 | 33 |
| LA4247 | 55.1 |
| LA4248 | 60.4 |
| LA4249A | 64.1 |
| LA4249B | 136.7 |
| LA4250B | 255.8 |
| LA4250C | 136.8 |
| LA4252A | 90.5 |
| LA4252F | 648.4 |
| LA4253 | 43.6 |
| LA4254 | 14 |
| LA4255 | 104.7 |
| LA4256 | 24.2 |
| LA4257 | 66.5 |
| LA4258 | 41.3 |
| LA4260 | 38.9 |
| LA4262A | 41.8 |
| LA4262B | 62.4 |
| LA4263B | 36.1 |
| LA4263C | 35.6 |
| LA4263D | 25.1 |
| LA4266A | 90.1 |
| LA4266B | 22.4 |
| LA4268 | 68.8 |
| LA4269 | 119.1 |
| LA4270B | 91.8 |
| LA4272 | 61.6 |
| LA4274 | 147.3 |
| LA4276A | 87.5 |
| LA4277 | 38.3 |
| LA4277B | 90.9 |
| LA4277C | 44.7 |
| LA4278A | 54.3 |
| LA4278B | 50 |
| LA4279 | 74.5 |
| LA4280 | 40.4 |
| LA4281A | 176.7 |
| LA4281B | 70.4 |
| LA4281D | 126.6 |
| LA4282A | 65.5 |
| LA4282B | 105.3 |
| LA4282C | 57.2 |
| LA4284 | 82.1 |
| LA4294A | 62.6 |
| LA4296 | 13.6 |
| LA4299 | 140 |
| LA4300A | 53.2 |
| LA4300B | 16.7 |
| LA4301A | 74.2 |
| LA4303 | 62.8 |
| LA4305 | 117.1 |
| LA4306A | 33.6 |
| LA4307 | 35.6 |
| LA4308 | 127.6 |
| LA4308A | 79 |
| LA4309 | 81.5 |
| LA4310 | 56.6 |
| LA4311 | 311.8 |
| LA4312A | 57.2 |
| LA4312B | 80 |
| LA4313A | 89.4 |
| LA4313B | 96.1 |
* Note
|