 |
 |
 |
 |
 |
 |
 |
 |
 |
 |
 |
 |
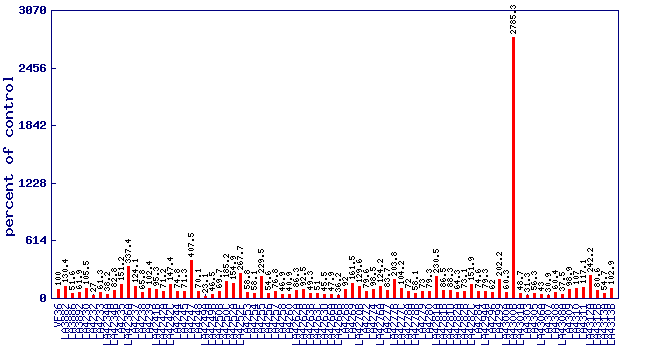
| Relative isobutyl acetate level (percent of control)* Experiment: flavor related metabolite profiling in S. lycopersicoides IL lines (FL, Fall 2015) |
 |
| line | relative level (percent of control) |
|---|---|
| VF36 | 100 |
| LA3882 | 130.4 |
| LA3886 | 51.6 |
| LA3892 | 61.9 |
| LA4230 | 105.5 |
| LA4232 | 27 |
| LA4233 | 61.3 |
| LA4234A | 38.2 |
| LA4234B | 82.8 |
| LA4235 | 151.2 |
| LA4236A | 337.4 |
| LA4237 | 124.1 |
| LA4238 | 65.8 |
| LA4239 | 102.4 |
| LA4241B | 95.3 |
| LA4242A | 71.2 |
| LA4242C | 147.4 |
| LA4244 | 74.8 |
| LA4245 | 71.3 |
| LA4247 | 407.5 |
| LA4248 | 70.1 |
| LA4249A | 23.1 |
| LA4249B | 46.5 |
| LA4250B | 69.7 |
| LA4250C | 185.2 |
| LA4252A | 154.9 |
| LA4252F | 267.7 |
| LA4253 | 58.8 |
| LA4254 | 58.1 |
| LA4255 | 229.5 |
| LA4256 | 54.6 |
| LA4257 | 76.8 |
| LA4258 | 46.9 |
| LA4260 | 40.9 |
| LA4262A | 86.3 |
| LA4262B | 92.5 |
| LA4263B | 49.3 |
| LA4263C | 51 |
| LA4263D | 45.5 |
| LA4266A | 47.9 |
| LA4266B | 36.2 |
| LA4268 | 92 |
| LA4269 | 161.5 |
| LA4270B | 129.6 |
| LA4272 | 79.6 |
| LA4274 | 98.5 |
| LA4276A | 124.2 |
| LA4277 | 83.7 |
| LA4277B | 203.8 |
| LA4277C | 104.2 |
| LA4278A | 72 |
| LA4278B | 58.1 |
| LA4279 | 73 |
| LA4280 | 79.3 |
| LA4281A | 230.5 |
| LA4281B | 86.5 |
| LA4281D | 88.3 |
| LA4282A | 64.3 |
| LA4282B | 73.1 |
| LA4282C | 151.9 |
| LA4284 | 74.6 |
| LA4294A | 79.3 |
| LA4296 | 62 |
| LA4299 | 202.2 |
| LA4300A | 60.3 |
| LA4300B | 2785.3 |
| LA4301A | 48.7 |
| LA4303 | 31.3 |
| LA4305 | 56.3 |
| LA4306A | 43 |
| LA4307 | 30.9 |
| LA4308 | 60.4 |
| LA4308A | 37.5 |
| LA4309 | 98.9 |
| LA4310 | 107 |
| LA4311 | 117.1 |
| LA4312A | 242.2 |
| LA4312B | 80.6 |
| LA4313A | 54.7 |
| LA4313B | 102.9 |
* Note
|