 |
 |
 |
 |
 |
 |
 |
 |
 |
 |
 |
 |
| Relative phenylacetaldehyde level (percent of control)* Experiment: flavor related metabolite profiling in S. lycopersicoides IL lines (FL, Fall 2015) |
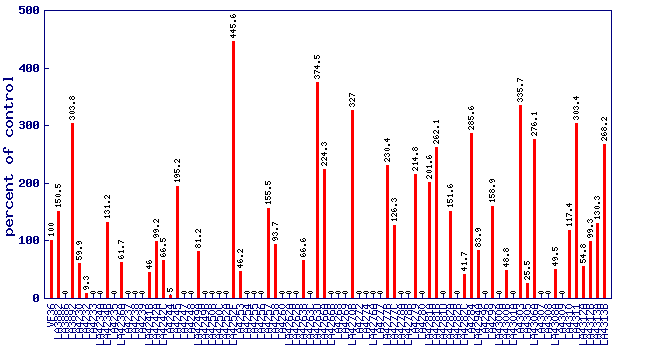 |
| line | relative level (percent of control) |
|---|---|
| VF36 | 100 |
| LA3882 | 150.5 |
| LA3886 | 0 |
| LA3892 | 303.8 |
| LA4230 | 59.9 |
| LA4232 | 9.3 |
| LA4233 | 0 |
| LA4234A | 0 |
| LA4234B | 131.2 |
| LA4235 | 0 |
| LA4236A | 61.7 |
| LA4237 | 0 |
| LA4238 | 0 |
| LA4239 | 0 |
| LA4241B | 46 |
| LA4242A | 99.2 |
| LA4242C | 66.5 |
| LA4244 | 5 |
| LA4245 | 195.2 |
| LA4247 | 0 |
| LA4248 | 0 |
| LA4249A | 81.2 |
| LA4249B | 0 |
| LA4250B | 0 |
| LA4250C | 0 |
| LA4252A | 0 |
| LA4252F | 445.6 |
| LA4253 | 46.2 |
| LA4254 | 0 |
| LA4255 | 0 |
| LA4256 | 0 |
| LA4257 | 155.5 |
| LA4258 | 93.7 |
| LA4260 | 0 |
| LA4262A | 0 |
| LA4262B | 0 |
| LA4263B | 66.6 |
| LA4263C | 0 |
| LA4263D | 374.5 |
| LA4266A | 224.3 |
| LA4266B | 0 |
| LA4268 | 0 |
| LA4269 | 0 |
| LA4270B | 327 |
| LA4272 | 0 |
| LA4274 | 0 |
| LA4276A | 0 |
| LA4277 | 0 |
| LA4277B | 230.4 |
| LA4277C | 126.3 |
| LA4278A | 0 |
| LA4278B | 0 |
| LA4279 | 214.8 |
| LA4280 | 0 |
| LA4281A | 201.6 |
| LA4281B | 262.1 |
| LA4281D | 0 |
| LA4282A | 151.6 |
| LA4282B | 0 |
| LA4282C | 41.7 |
| LA4284 | 285.6 |
| LA4294A | 83.9 |
| LA4296 | 0 |
| LA4299 | 158.9 |
| LA4300A | 0 |
| LA4300B | 48.8 |
| LA4301A | 0 |
| LA4303 | 335.7 |
| LA4305 | 25.5 |
| LA4306A | 276.1 |
| LA4307 | 0 |
| LA4308 | 0 |
| LA4308A | 49.5 |
| LA4309 | 0 |
| LA4310 | 117.4 |
| LA4311 | 303.4 |
| LA4312A | 54.8 |
| LA4312B | 99.3 |
| LA4313A | 130.3 |
| LA4313B | 268.2 |
* Note
|