 |
 |
 |
 |
 |
 |
 |
 |
 |
 |
 |
 |
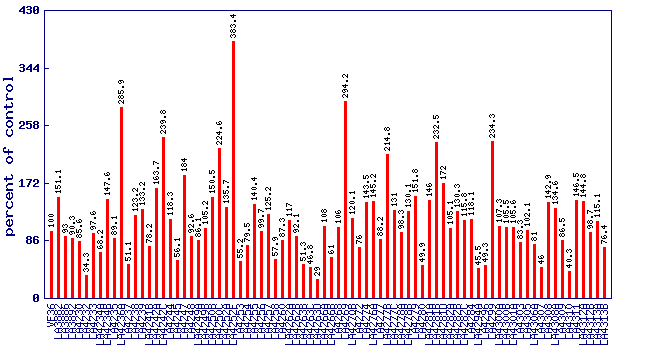
| Relative trans-2-pentenal level (percent of control)* Experiment: flavor related metabolite profiling in S. lycopersicoides IL lines (FL, Fall 2015) |
 |
| line | relative level (percent of control) |
|---|---|
| VF36 | 100 |
| LA3882 | 151.1 |
| LA3886 | 93 |
| LA3892 | 90.3 |
| LA4230 | 85.6 |
| LA4232 | 34.3 |
| LA4233 | 97.6 |
| LA4234A | 68.2 |
| LA4234B | 147.6 |
| LA4235 | 89.1 |
| LA4236A | 285.9 |
| LA4237 | 51.1 |
| LA4238 | 123.2 |
| LA4239 | 133.2 |
| LA4241B | 78.2 |
| LA4242A | 163.7 |
| LA4242C | 239.8 |
| LA4244 | 118.3 |
| LA4245 | 56.1 |
| LA4247 | 184 |
| LA4248 | 92.6 |
| LA4249A | 86.1 |
| LA4249B | 105.2 |
| LA4250B | 150.5 |
| LA4250C | 224.6 |
| LA4252A | 135.7 |
| LA4252F | 383.4 |
| LA4253 | 55.2 |
| LA4254 | 79.5 |
| LA4255 | 140.4 |
| LA4256 | 99.7 |
| LA4257 | 125.2 |
| LA4258 | 57.9 |
| LA4260 | 87.3 |
| LA4262A | 117 |
| LA4262B | 92.1 |
| LA4263B | 51.3 |
| LA4263C | 46.8 |
| LA4263D | 29 |
| LA4266A | 108 |
| LA4266B | 61 |
| LA4268 | 106 |
| LA4269 | 294.2 |
| LA4270B | 120.1 |
| LA4272 | 76 |
| LA4274 | 143.5 |
| LA4276A | 145.2 |
| LA4277 | 88.2 |
| LA4277B | 214.8 |
| LA4277C | 131 |
| LA4278A | 98.3 |
| LA4278B | 130.1 |
| LA4279 | 151.8 |
| LA4280 | 49.9 |
| LA4281A | 146 |
| LA4281B | 232.5 |
| LA4281D | 172 |
| LA4282A | 105.1 |
| LA4282B | 130.3 |
| LA4282C | 115.8 |
| LA4284 | 118.1 |
| LA4294A | 45.5 |
| LA4296 | 49.3 |
| LA4299 | 234.3 |
| LA4300A | 107.3 |
| LA4300B | 105.5 |
| LA4301A | 105.6 |
| LA4303 | 83.3 |
| LA4305 | 102.1 |
| LA4306A | 81 |
| LA4307 | 46 |
| LA4308 | 142.9 |
| LA4308A | 134.6 |
| LA4309 | 86.5 |
| LA4310 | 40.3 |
| LA4311 | 146.5 |
| LA4312A | 144.8 |
| LA4312B | 98.7 |
| LA4313A | 115.1 |
| LA4313B | 76.4 |
* Note
|