 |
 |
 |
 |
 |
 |
 |
 |
 |
 |
 |
 |
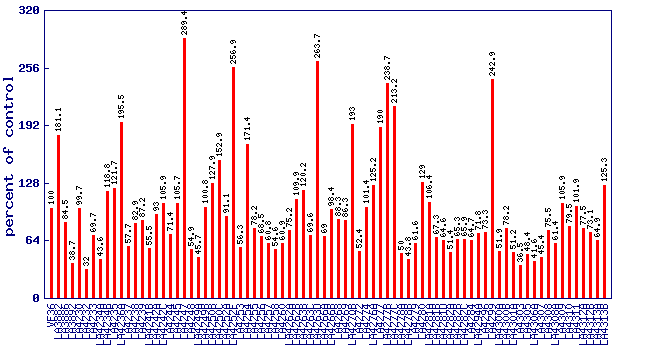
| Relative 2-methyl-2-butenal level (percent of control)* Experiment: flavor related metabolite profiling in S. lycopersicoides IL lines (FL, Fall 2015) |
 |
| line | relative level (percent of control) |
|---|---|
| VF36 | 100 |
| LA3882 | 181.1 |
| LA3886 | 84.5 |
| LA3892 | 38.7 |
| LA4230 | 99.7 |
| LA4232 | 32 |
| LA4233 | 69.7 |
| LA4234A | 43.6 |
| LA4234B | 118.8 |
| LA4235 | 121.7 |
| LA4236A | 195.5 |
| LA4237 | 57.7 |
| LA4238 | 82.9 |
| LA4239 | 87.2 |
| LA4241B | 55.5 |
| LA4242A | 93 |
| LA4242C | 105.9 |
| LA4244 | 71.4 |
| LA4245 | 105.7 |
| LA4247 | 289.4 |
| LA4248 | 54.9 |
| LA4249A | 45.7 |
| LA4249B | 100.8 |
| LA4250B | 127.9 |
| LA4250C | 152.9 |
| LA4252A | 91.1 |
| LA4252F | 256.9 |
| LA4253 | 56.3 |
| LA4254 | 171.4 |
| LA4255 | 78.2 |
| LA4256 | 68.5 |
| LA4257 | 60.8 |
| LA4258 | 54.6 |
| LA4260 | 60.9 |
| LA4262A | 75.2 |
| LA4262B | 109.9 |
| LA4263B | 120.2 |
| LA4263C | 69.6 |
| LA4263D | 263.7 |
| LA4266A | 69 |
| LA4266B | 98.4 |
| LA4268 | 88.3 |
| LA4269 | 86.3 |
| LA4270B | 193 |
| LA4272 | 52.4 |
| LA4274 | 101.4 |
| LA4276A | 125.2 |
| LA4277 | 190 |
| LA4277B | 238.7 |
| LA4277C | 213.2 |
| LA4278A | 50 |
| LA4278B | 43.8 |
| LA4279 | 61.6 |
| LA4280 | 129 |
| LA4281A | 106.4 |
| LA4281B | 67.3 |
| LA4281D | 64.6 |
| LA4282A | 51.4 |
| LA4282B | 65.3 |
| LA4282C | 65.9 |
| LA4284 | 64.7 |
| LA4294A | 71.8 |
| LA4296 | 73.3 |
| LA4299 | 242.9 |
| LA4300A | 51.9 |
| LA4300B | 78.2 |
| LA4301A | 51.2 |
| LA4303 | 36.5 |
| LA4305 | 48.4 |
| LA4306A | 41.6 |
| LA4307 | 45.4 |
| LA4308 | 75.5 |
| LA4308A | 61.4 |
| LA4309 | 105.9 |
| LA4310 | 79.5 |
| LA4311 | 101.9 |
| LA4312A | 77.5 |
| LA4312B | 73.1 |
| LA4313A | 64.9 |
| LA4313B | 125.3 |
* Note
|