 |
 |
 |
 |
 |
 |
 |
 |
 |
 |
 |
 |
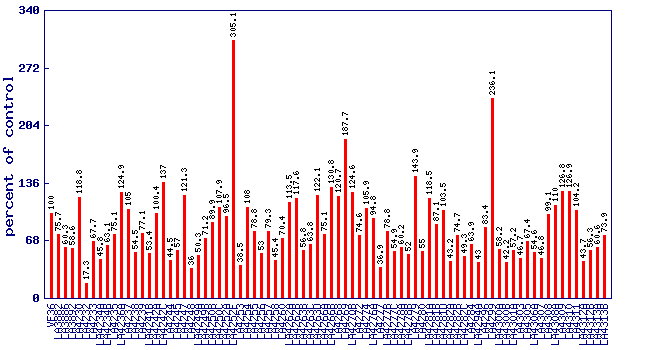
| Relative 3-methyl-2-butenal level (percent of control)* Experiment: flavor related metabolite profiling in S. lycopersicoides IL lines (FL, Fall 2015) |
 |
| line | relative level (percent of control) |
|---|---|
| VF36 | 100 |
| LA3882 | 75.7 |
| LA3886 | 60.3 |
| LA3892 | 58.6 |
| LA4230 | 118.8 |
| LA4232 | 17.3 |
| LA4233 | 67.7 |
| LA4234A | 45.8 |
| LA4234B | 63.1 |
| LA4235 | 75.1 |
| LA4236A | 124.9 |
| LA4237 | 105 |
| LA4238 | 54.5 |
| LA4239 | 77.1 |
| LA4241B | 53.4 |
| LA4242A | 100.4 |
| LA4242C | 137 |
| LA4244 | 44.5 |
| LA4245 | 57 |
| LA4247 | 121.3 |
| LA4248 | 36 |
| LA4249A | 50.3 |
| LA4249B | 71.2 |
| LA4250B | 89.9 |
| LA4250C | 107.9 |
| LA4252A | 96.5 |
| LA4252F | 305.1 |
| LA4253 | 38.5 |
| LA4254 | 108 |
| LA4255 | 78.8 |
| LA4256 | 53 |
| LA4257 | 79.3 |
| LA4258 | 45.4 |
| LA4260 | 70.4 |
| LA4262A | 113.5 |
| LA4262B | 117.6 |
| LA4263B | 56.8 |
| LA4263C | 63.8 |
| LA4263D | 122.1 |
| LA4266A | 75.1 |
| LA4266B | 130.8 |
| LA4268 | 120.7 |
| LA4269 | 187.7 |
| LA4270B | 124.6 |
| LA4272 | 74.6 |
| LA4274 | 105.9 |
| LA4276A | 94.8 |
| LA4277 | 36.9 |
| LA4277B | 78.8 |
| LA4277C | 54.9 |
| LA4278A | 60.2 |
| LA4278B | 52 |
| LA4279 | 143.9 |
| LA4280 | 55 |
| LA4281A | 118.5 |
| LA4281B | 87.1 |
| LA4281D | 103.5 |
| LA4282A | 43.2 |
| LA4282B | 74.7 |
| LA4282C | 49.3 |
| LA4284 | 63.9 |
| LA4294A | 43 |
| LA4296 | 83.4 |
| LA4299 | 236.1 |
| LA4300A | 58.2 |
| LA4300B | 42.2 |
| LA4301A | 57.2 |
| LA4303 | 46.7 |
| LA4305 | 67.4 |
| LA4306A | 54.6 |
| LA4307 | 46.8 |
| LA4308 | 99.1 |
| LA4308A | 110 |
| LA4309 | 126.8 |
| LA4310 | 126.9 |
| LA4311 | 104.2 |
| LA4312A | 43.7 |
| LA4312B | 56.3 |
| LA4313A | 60.6 |
| LA4313B | 73.9 |
* Note
|