 |
 |
 |
 |
 |
 |
 |
 |
 |
 |
 |
 |
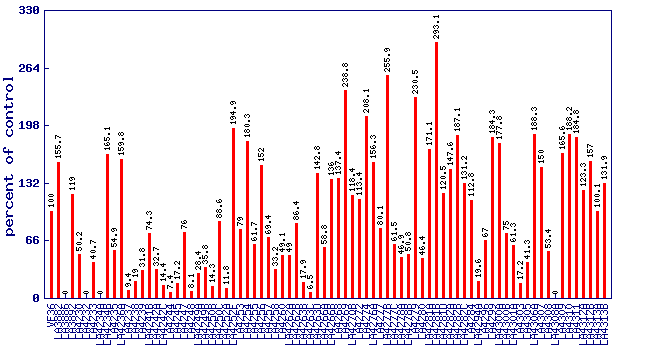
| Relative n-decyl aldehyde level (percent of control)* Experiment: flavor related metabolite profiling in S. lycopersicoides IL lines (FL, Fall 2015) |
 |
| line | relative level (percent of control) |
|---|---|
| VF36 | 100 |
| LA3882 | 155.7 |
| LA3886 | 0 |
| LA3892 | 119 |
| LA4230 | 50.2 |
| LA4232 | 0 |
| LA4233 | 40.7 |
| LA4234A | 0 |
| LA4234B | 165.1 |
| LA4235 | 54.9 |
| LA4236A | 159.8 |
| LA4237 | 9.4 |
| LA4238 | 19 |
| LA4239 | 31.8 |
| LA4241B | 74.3 |
| LA4242A | 32.7 |
| LA4242C | 14.4 |
| LA4244 | 7.4 |
| LA4245 | 17.2 |
| LA4247 | 76 |
| LA4248 | 8.1 |
| LA4249A | 28.4 |
| LA4249B | 35.8 |
| LA4250B | 14.3 |
| LA4250C | 88.6 |
| LA4252A | 11.8 |
| LA4252F | 194.9 |
| LA4253 | 79 |
| LA4254 | 180.3 |
| LA4255 | 61.7 |
| LA4256 | 152 |
| LA4257 | 69.4 |
| LA4258 | 33.2 |
| LA4260 | 49.1 |
| LA4262A | 49 |
| LA4262B | 86.4 |
| LA4263B | 17.9 |
| LA4263C | 6.5 |
| LA4263D | 142.8 |
| LA4266A | 58.8 |
| LA4266B | 136 |
| LA4268 | 137.4 |
| LA4269 | 238.8 |
| LA4270B | 118.4 |
| LA4272 | 113.4 |
| LA4274 | 208.1 |
| LA4276A | 156.3 |
| LA4277 | 80.1 |
| LA4277B | 255.9 |
| LA4277C | 61.5 |
| LA4278A | 46.9 |
| LA4278B | 50.8 |
| LA4279 | 230.5 |
| LA4280 | 46.4 |
| LA4281A | 171.1 |
| LA4281B | 293.1 |
| LA4281D | 120.5 |
| LA4282A | 147.6 |
| LA4282B | 187.1 |
| LA4282C | 131.2 |
| LA4284 | 112.8 |
| LA4294A | 19.6 |
| LA4296 | 67 |
| LA4299 | 184.3 |
| LA4300A | 177.8 |
| LA4300B | 75 |
| LA4301A | 61.3 |
| LA4303 | 17.2 |
| LA4305 | 41.3 |
| LA4306A | 188.3 |
| LA4307 | 150 |
| LA4308 | 53.4 |
| LA4308A | 0 |
| LA4309 | 165.6 |
| LA4310 | 188.2 |
| LA4311 | 184.8 |
| LA4312A | 123.3 |
| LA4312B | 157 |
| LA4313A | 100.1 |
| LA4313B | 131.9 |
* Note
|