 |
 |
 |
 |
 |
 |
 |
 |
 |
 |
 |
 |
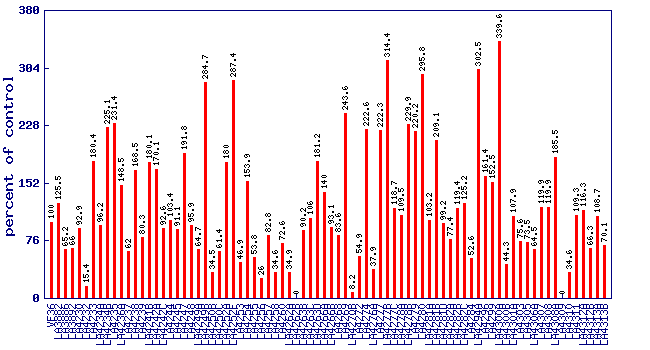
| Relative nonyl aldehyde level (percent of control)* Experiment: flavor related metabolite profiling in S. lycopersicoides IL lines (FL, Fall 2015) |
 |
| line | relative level (percent of control) |
|---|---|
| VF36 | 100 |
| LA3882 | 125.5 |
| LA3886 | 65.2 |
| LA3892 | 66 |
| LA4230 | 92.9 |
| LA4232 | 15.4 |
| LA4233 | 180.4 |
| LA4234A | 96.2 |
| LA4234B | 225.1 |
| LA4235 | 231.4 |
| LA4236A | 148.5 |
| LA4237 | 62 |
| LA4238 | 168.5 |
| LA4239 | 80.3 |
| LA4241B | 180.1 |
| LA4242A | 170.1 |
| LA4242C | 92.6 |
| LA4244 | 103.4 |
| LA4245 | 91.1 |
| LA4247 | 191.8 |
| LA4248 | 95.9 |
| LA4249A | 64.7 |
| LA4249B | 284.7 |
| LA4250B | 34.5 |
| LA4250C | 61.4 |
| LA4252A | 180 |
| LA4252F | 287.4 |
| LA4253 | 46.9 |
| LA4254 | 153.9 |
| LA4255 | 53.8 |
| LA4256 | 26 |
| LA4257 | 82.8 |
| LA4258 | 34.6 |
| LA4260 | 72.6 |
| LA4262A | 34.9 |
| LA4262B | 0 |
| LA4263B | 90.2 |
| LA4263C | 106 |
| LA4263D | 181.2 |
| LA4266A | 140 |
| LA4266B | 93.1 |
| LA4268 | 83.6 |
| LA4269 | 243.6 |
| LA4270B | 8.2 |
| LA4272 | 54.9 |
| LA4274 | 222.6 |
| LA4276A | 37.9 |
| LA4277 | 222.3 |
| LA4277B | 314.4 |
| LA4277C | 118.7 |
| LA4278A | 109.5 |
| LA4278B | 229.9 |
| LA4279 | 220.2 |
| LA4280 | 295.8 |
| LA4281A | 103.2 |
| LA4281B | 209.1 |
| LA4281D | 99.2 |
| LA4282A | 77.4 |
| LA4282B | 119.4 |
| LA4282C | 125.2 |
| LA4284 | 52.6 |
| LA4294A | 302.5 |
| LA4296 | 161.4 |
| LA4299 | 152.5 |
| LA4300A | 339.6 |
| LA4300B | 44.3 |
| LA4301A | 107.9 |
| LA4303 | 75.6 |
| LA4305 | 73.5 |
| LA4306A | 64.5 |
| LA4307 | 119.9 |
| LA4308 | 119.9 |
| LA4308A | 185.5 |
| LA4309 | 0 |
| LA4310 | 34.6 |
| LA4311 | 109.3 |
| LA4312A | 116.3 |
| LA4312B | 66.3 |
| LA4313A | 108.7 |
| LA4313B | 70.1 |
* Note
|