Tomato Epigenome Database |
|
Introduction Functions Search DNA methylation Plot methylation profiles Search genes Blast Genome browser Contact |
DNA methylation search formUser can just use gene ID to search database, or search gene ID with upstream and downstream information. If user searches using chromosme ID, then starting and ending positions must be entered. 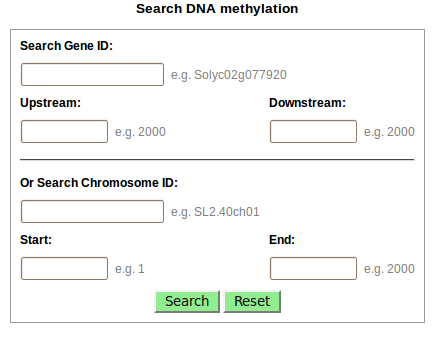
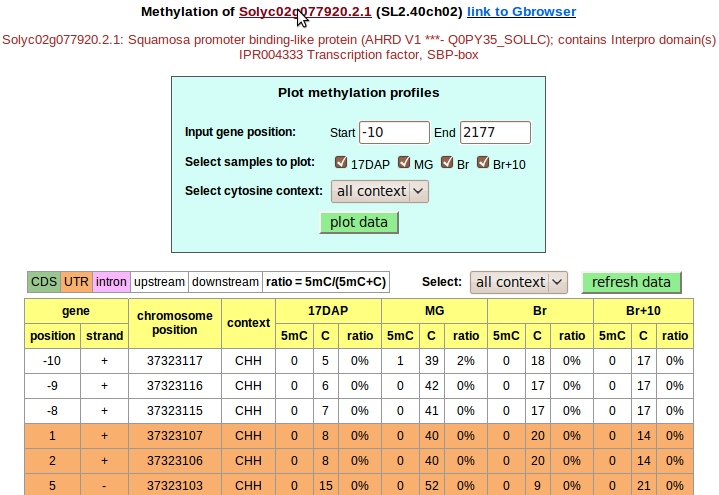
Display dataAfter successful searching, DNA methylation data in 4 development stage will be displayed in detail, user can hover on gene ID to get gene annotation. All ratio greater than 50% are highlighted in green color.
In the table, different color represents different region, color code is listed on the left top of the table.
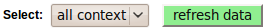
On the right top of the table, user can choose specific context and click refresh data button to refine the table.
Plot dataTop form is used to plot DNA methylation profiles within the range of this table, user can choose any sample and context combination to plot data. 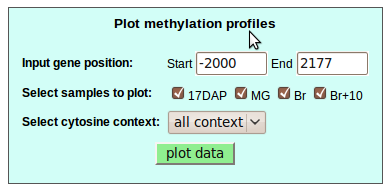
After clicking plot data button, the image will be displayed. 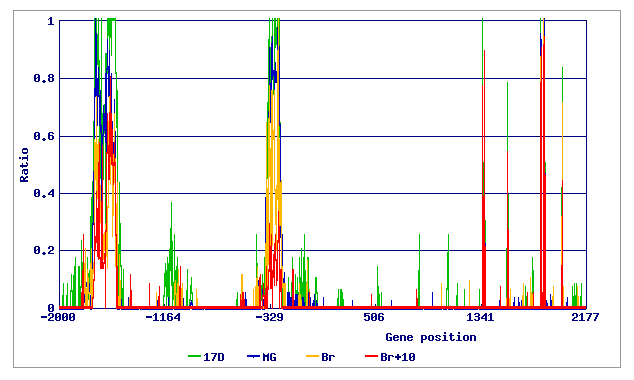
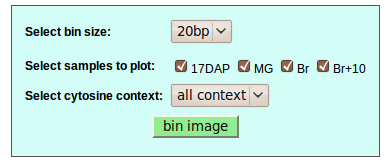
Bin imageThe form below is used for re-plot the image with selected bin size, sample and context, i.e. if image is too dense, you can use provided bin size to re-plot the image.
For example: The image with 20bp bin size: 
|

Fei Bioinformatics Lab, Boyce Thompson Institute and USDA Robert W. Holley Center |